Earlier this month, our product manager, Eric Warth put together a few quick (3-5 min) videos to help new users with some of the basics of setting up your software status page. I’ll be sharing them one at a time on this blog, but you can view them as we post them up on YouTube here.
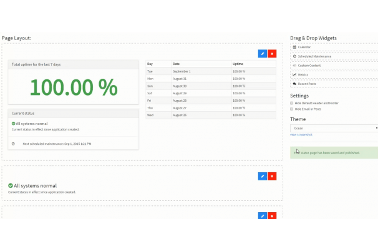
Here’s the first in the series, Customizing Your Status Page:
Every time you interact with a customer, they are further developing their opinion about your company. If you don’t make it easy for customers to associate that interaction with your company (by making your logo, color scheme, tagline, etc. front-and-center when they are having the positive experience), they are less likely to remember the impression you’ve made with them days or weeks after the fact. This means that they are less likely to think of you when they have a problem your company can help with, and that they are less likely to generate leads for your company via word of mouth when talking with their friends and colleagues.
Additionally, if your branding isn’t consistent, you not only risk failing to make a good impression, you actually risk making a bad impression. A company that can’t keep its branding consistent gives the impression of being out-of-touch, sloppy, and/or disorganized.
A quick and painless set-up also means that even if it is weeks or months before your users experience application downtime, you don’t feel like you wasted time or energy on your software status page. And if you realize things need to be changed after the first time your users receive notifications from your status page and/or visit the page– it’s just as easy to update your status page as it was to set up in the first place.
What kind of changes would you need to make? For instance, you might decide putting upcoming scheduled maintenance lower than the historical uptime status helps reinforce for your customers that your software’s track record is actually quite excellent – despite a recent disruption in service.
One of the chief benefits of a software status page is that it establishes an historical track record for your company/product that you can point to when things go wrong and say “we’ve always been transparent about our product’s performance and have made it as easy as possible for our users to receive information and updates about performance issues.”
Next week, I’ll share Eric’s video covering incident reports, and as I did here provide some additional context to why they are an important part of your downtime communication plan.
Like most application performance monitoring software (APM) solutions, SiteScope is designed to help your IT team spend less time struggling with incidents and instead spend more time identifying and mitigating risks before they become incidents.
Similarly, the status page software StatusCast is designed to take the burden of communicating about scheduled maintenance, unplanned downtime, and other uptime-related alerts and updates off of your IT team.
Together, these tools empower your IT team to focus on the ounce of prevention rather than the pound of treatment.
Technologically speaking – how can these tools work together?
SiteScope can run on Windows, UNIX, and Linux platforms. It monitors more than 100 different target types for critical health and performance characteristics (including tools from Amazon, Hadoop, Cisco, Citrix, Microsoft, Oracle/Sun, SAP, SAS, Siebel, VMware, WebLogic and other custom monitors via the Live Network), and bridges the gap from IT pro to typical end-user through its integration with application status page tools like StatusCast.
SiteScope also integrates with other products and services, most notably Operations Manager (proactively performs root cause analysis) and Performance Center (facilitates application performance testing). SiteScope’s integration with Operations Manager actually allows for agentless monitoring across heterogeneous IT infrastructure components. This is significant because without an agent infrastructure in place, most APM tools can only monitor network components on the same environment.
This provides your customers with transparency about the performance of your application. StatusCast can send updates to your end users immediately, it can be set to wait a certain amount of time before sending updates, or it can be set to not send any updates without manual intervention (see workflows below, under Step 2. Automate incident posting). Likely you will send different updates at each of the three settings, as some issues are best handled by immediate transparency with the customer, others are better communicated after they’re better understood by your team, and some may require human attention before being sent out at all.
StatusCast makes communicating with your end users an easy task, without compromising the quality of that communication. This is because you are using information you already have at your fingertips—in SiteScope—and merely applying that information to another audience (after a bit of polishing)—your end users!
Copy your API Key, navigate to the Integrations section of your StatusCast admin portal [yourapp].statuscast.com/admin), and select the Install button under HP SiteScope.
Choose HP SiteScope from the Choose Provider drop down.
Next, select the Alert Name from the list (this will correspond to a specific application in your SiteScope account). Enter a name for Authored by, which defines who is the author of each incident. Just like normal incidents, a post can have only a single author:
The other Incident settings, including Type, Affected components, Subject, and Message, reflect the same general options you have when creating an incident. For more information on this process, please refer to StatusCast’s article How Do I Post a New Incident or Status?
At this point you can set up a workflow for the incident:
Once you set all the configurations, click Submit to save the configuration.
To configure the metric, navigate to the Layout section. Drag the Metric widget into your pages layout, select the pencil edit icon, and select New Metric.
From here you can configure the metric you’d like to display:
Display name: Enter a friendly name to identify this metric within StatusCast.
Choose provider: Select HP SiteScope as your provider.
Choose application: Select the application from your SiteScope account from which you want metric data made available to StatusCast.
Metric: Select the type of metric you wish to make available, e.g., Response Time.
Select Save to add the SiteScope metric to your layout, and to finalize these changes, select the Save & Publish option on the right.
Now that your metric has been added to your StatusCast page, navigate to the page to see it in action!
I hope this blog has helped you understand some of the monitoring capabilities of SiteScope and what an integration with StatusCast can do for you.
The three primary goals of a hosted status page are:
Similarly, using a webhook integration, StatusCast pulls designated alerts from PagerDuty, allows you to rephrase them into terms more relevant to your end-users, and sends them out to impacted users via each individual user’s preferred communication channel. As with all status updates in StatusCast, you can program them to send immediately, to send automatically but with a time delay, or to require manual approval before being sent at all.
StatusCast helps you bridge the customer experience gap by sending out alerts based on affected components (meaning only impacted customers receive the communication), and sending them out through the communications channel your customers have identified themselves to be most effective for status updates.
StatusCast is built with a similar idea in mind – though downtime is unlikely, to an extent it is unavoidable. Rather than deny that unpleasant truth, better to be prepared to handle it professionally. By providing the history of uptime on your hosted status page, you are reminding customers when downtime occurs that it is a rare occurrence rather than the norm.
One of the reasons StatusCast was built as a hosted status page tool in the first place was to help IT/DevOps focus on resolving the issues impeding application performance, by taking the burden of communicating about the issue and its resolution off of that team’s shoulders. By working with another team (for instance Marketing) in advance, to ensure the customer-facing alert language is user-friendly but accurate, IT/DevOps can free themselves to focus on what they do best when the need for their timely attention is at its greatest.
I’ve written on the StatusCast blog before about integration between a status page and application monitoring tools, namely WHY you would want to. This post is designed to be more of a teaser look at the many options you have for HOW.
Binary Canary operates from the philosophy that downtime is bound to occur – resources and energy should instead be invested into streamlining the process for identifying, repairing and communicating problems to customers as much as possible.
New Relic allows SaaS companies to monitor and boost performance for their entire web-based application environment. Click the above link to see a step-by-step guide for completing the integration between New Relic’s application monitoring and StatusCast’s status page.
Paessler utilizes remote probes, sensor types and push notifications to keep you informed about network availability, performance and usage.
Panopta combines globally-distributed network service checking with an on-server agent and a virtual appliance, to ensure all aspects of your infrastructure are being monitored, with precision.
As with other application monitoring tools, Pingdom is able to filter out false alerts and analyze performance from the user’s perspective. It focuses on key transactional parts of your website or web-based application (e.g. login, search, make purchases) and ensures that they are not experiencing issues.
Uptime Robot is a free application monitoring tool that includes many of the features the paid alternatives offer. Though they still offer a free plan, earlier this year they released a Pro Plan as well. The Pro Plan monitors at more frequent intervals, can accommodate additional monitors, and retains a longer period of logging.
The above are just a sampling of the different application monitoring tools StatusCast integrates with. If you are looking to integrate a status page with your company’s solution, please contact us for more information.
Uptime status is only fully reflected in systems that measure activity on both sides –the server side and the user side. Paessler AG’s suite of network monitoring solutions equips software companies to do just that – managing network availability, performance and usage efficiently. It accomplishes this through remote probes, differentiated sensor types, and push notifications.
Remote probes allow you to monitor diverse networks, for instance subsidiaries, independent networks within your company, and most importantly your customers’ networks. This allows you to determine with greater accuracy whether your end users are experiencing performance issues or not and if so, precisely where the source of the issue resides.
With over 200 sensor types available “out of the box” and the ability to monitor as many as 20,000 sensors per installation through Paessler Router Traffic Grapher (PRTG) Network Monitor, network monitoring can be tailored to your needs. Even a netbook can monitor on average 1,500 sensors, meaning the demand of PRTG on your system is minimal.
The ability to send IT/DevOps push notifications via the preferred communication channel (e.g. email, text messaging, etc.) means that you can ensure the right person knows at the right time when there is a slow or failing sensor, or when sensor channels break predefined threshold values (i.e. when there’s a problem).
What does all of this have to do with sharing uptime status? StatusCast has been built to integrate with application performance monitoring (APM) solutions like Paessler’s to translate the information your IT/DevOps team receives from tools like PRTG into an update your end users can understand. Just like DevOps can receive push notifications from PRTG when the network is experiencing issues, you can allow your end users to subscribe to alerts via their preferred communication method.
Though they will never appreciate problems with accessing or using your application, end users do appreciate the transparency and convenience of a timely uptime status. By providing this in language they can understand (i.e. non-tech literate) and in a way that does not take time and attention away from IT/DevOps when they need to be focusing on repairing the issue itself, you are ensuring service disruptions have the minimum impact possible on your customers and as a result on your business.
As with New Relic, Pingdom can transmit uptime and other performance data to hosted status pages automatically and translate that data into terms relevant to your customers. This is achieved through an integration with StatusCast. Just as Pingdom sends you (or your IT team) a notification, StatusCast sends a notification to those customers impacted by the application outage (or whatever other performance issue there may be). In this manner,
StatusCast helps you get ahead of the wave of confusion and frustration from customers as a result of unexpected application downtime.
Much of customer confusion and frustration can be avoided by simply doing a better job at setting expectations.
A hosted status page can serve as the go-to means for customers to find out when your application will be unavailable due to scheduled maintenance or to periodic testing for things like system stress and disaster recovery.
As an additional benefit, StatusCast is designed to be simple enough that non-technical staff can use it. Once your DevOps or IT team clarifies what audiences are impacted by what triggers in Pingdom (or whatever APM you’re using), your Marketing team can take care of actually crafting a message that your average end user can understand, that appropriately sets expectations with your end user customers, and that includes other relevant information you’d want those customers to be aware of. This empowers Marketing to do what they do best.
Image courtesy of the Pingdom blog.
An application status page translates the technical information you’re getting from your application performance management tool into more customer-appropriate terminology about application availability.
This information can be shared in real-time, edited or merely delayed before sharing, or omitted/restricted entirely if it isn’t suitable for customer consumption.
The extent to which this information needs to be delayed and/or manually filtered will depend on the nature of your business and the nature of the information you receive from your application performance management tool.
It’s also possible that it will take some time to determine how long or extensive the interruption will last. In this case it’s important to include information on your application status page to appropriately set customer expectations.
In these situations, it may be beneficial to set-up some automated alerts but leave other issues to manual intervention/involvement. You can check out similar features that Statuscast provides.
If you need to segment information by audience, your application status page can be set up to limit access by password, custom invite and/or IP address.
Additionally, a well-designed status page can be broken down by sub-components, geographical locations, varying servers, etc. This type of status page will allow you to be honest with your end-user base while limiting your downtime statistics to individual areas. For example, if you have redundant installations and you temporarily take a server down for maintenance you can provide this information without it affecting your overall service levels.
To make things as convenient as possible and prevent end-users from becoming agitated, you can use your application status page to send out email, SMS (text message), and other alerts (edited or automated). Being transparent and making your updates convenient and accessible will help you to smoothly reset customer expectations.
The StatusCast team has worked in the SaaS world for over a decade and as a result, we understand that this kind of unfiltered, real-time updating is not appropriate for every hosted application. StatusCast has been designed to accommodate rules-based automation (informed by APM data) and manual communication (i.e. no message goes out automatically), in addition to unfiltered, real-time updates.
Customers respect and appreciate a business that is transparent, accountable, and dedicated to making things more convenient for its customers. This makes the business seem more like a proud provider of genuine value than another off-putting example of the stereotype of the exploitative used car salesman.
“Integrate” does not mean “use simultaneously”; it’s more than that. Integrating your hosted status pages with other software tools allows you to do two things:
1) easily pass information between systems, so you don’t have to copy + paste or worse: recreate from scratch
2) automate, so you only have to set something up once and can trust it to function as designed every subsequent time
The difference between non-integrated and integrated systems is like the difference between mailing a check for your phone or utility bill on time every month vs. setting up an account with auto-payment or one-click payment that can be confirmed, scheduled, and/or updated from any device.
Read more about hosted status pages and hosted status page integrations.
We are excited to announce the Uptime.ly REST API! As with any initial version, we expect you will have suggestions. And when you do, post a response or send us an email.
You can access our REST API knowledge base here: http://bit.ly/19OfuL5
Our goal is to make sure that you can interact with our service in the ways that meets your needs. The API is designed to give you comprehensive access to Uptime.ly functionality. Here are a few ways we anticipate you will find our API useful.
Now for the fun part. You try out our API and give us feedback by 10/31/2013 and we will set you up with an Enterprise account for 1 year. We look forward to learning about how you integrate with Uptime.ly!
© Copyright StatusCast 2022 | Terms & Conditions | Privacy Policy