


When your status page is buzzing with lots of information (and we hope it is!) you may find that viewing everything on a single page can be a bit overwhelming. For many of your end-users they may only be interested in a single type of incident or maybe a few components.
Today we’ve added a new Incident Details page to help end-users get to the point and see data that’s relevant to them. Here’s how it works.
<iframe width="1030" height="773" src="https://www.youtube.com/embed/_ong86IO0dc" title="StatusCast's Incident Detail Page" frameborder="0" allow="accelerometer; autoplay; clipboard-write; encrypted-media; gyroscope; picture-in-picture; web-share" allowfullscreen></iframe>
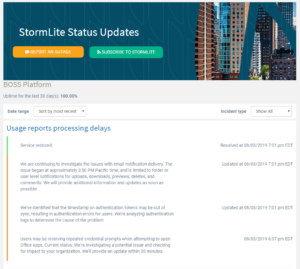
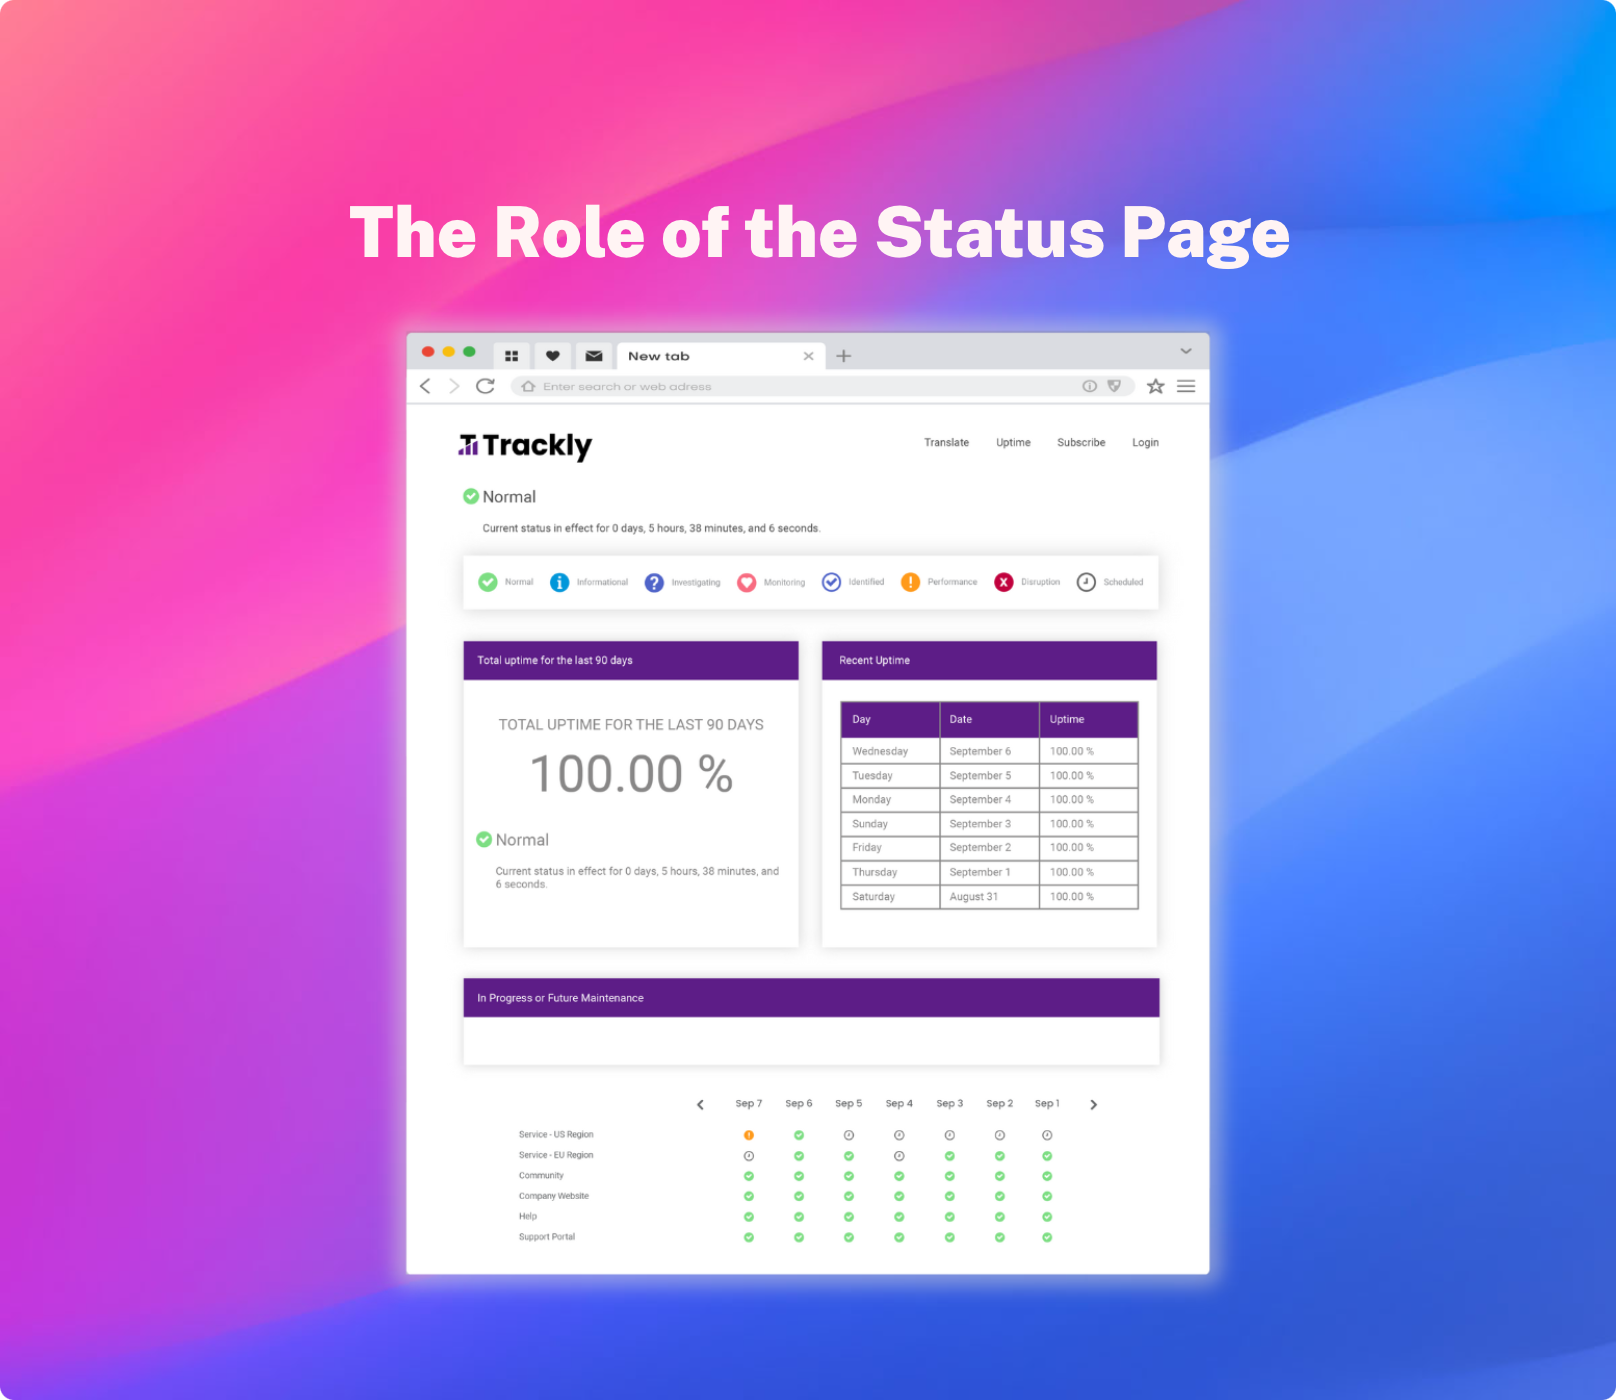
StatusCast offers a variety of widgets for displaying your information on the main status page. We’ve made many of these items clickable with this release, allowing you to drill down directly into a list of incidents that match the specific component or incident type.
The details page contains a list of incidents based on the filters (incident type or component), and from there you can filter the page further by selecting a custom date range. Details pages by default will show uptime % data based on your filter.
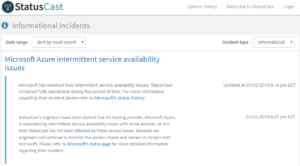
This type of page can be utilized in lots of different ways. Status pages aren’t always about incidents; often we see organization’s use their status page to primarily convey maintenance information and product releases. When you view a filtered details page the URL will be specific to that view, so you can easily grab a link and hard code it in an email or on your website. Take a look at StatusCast’s maintenance page to see a live example.
With this new page your users can easily view incidents that answer the following kinds of questions:
Show me all the recent incidents from our cloud provider DropBox?
Show me all upcoming scheduled maintenance events for our e-mail server?
Your status page might have a wide range of components; maybe representing several apps or products, and with a component details page you can provide your end users a quick way to see data specific to that application or product. You can select parent components to show an entire groups worth of incidents or individual sub-components to get as specific of a view as you’d like.